Note
Click here to download the full example code
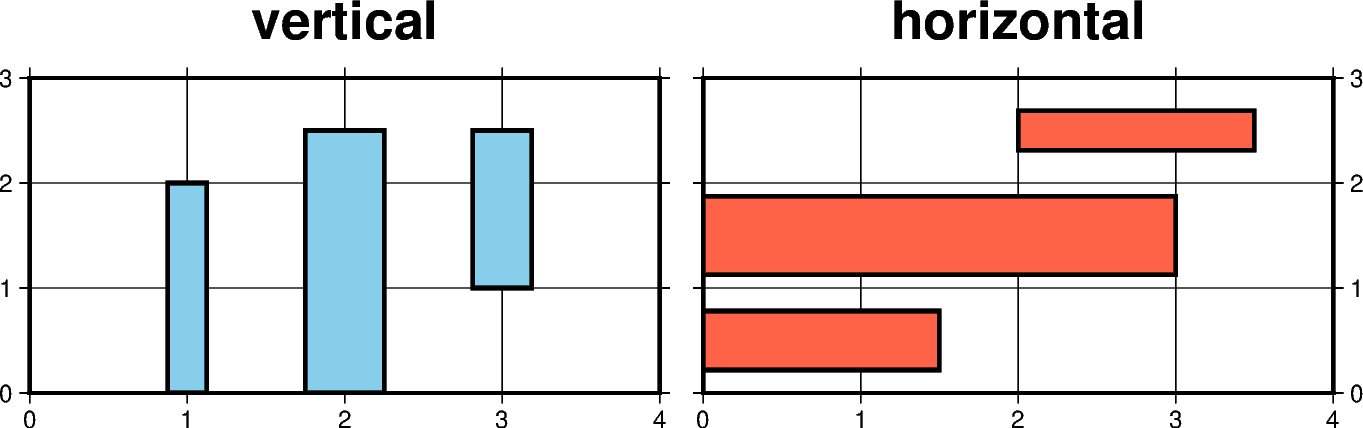
Vertical or horizontal bar
The pygmt.Figure.plot method can plot vertical (b) or
horizontal (B) bars by passing the corresponding shortcut to
the style parameter.
Out:
<IPython.core.display.Image object>
import pygmt

fig = pygmt.Figure()

with fig.subplot(
    nrows=1, ncols=2, subsize=("8c", "4c"), frame=["ag", "WSne"], sharey=True
):

    pen = "1.5p"
    with fig.set_panel(panel=0):
        color = "skyblue"
        fig.basemap(region=[0, 4, 0, 3], frame="+tvertical")
        fig.plot(x=1, y=2, style="b0.5c", color=color, pen=pen)
        fig.plot(x=2, y=2.5, style="b1c", color=color, pen=pen)
        fig.plot(x=3, y=2.5, style="b0.75c+b1", color=color, pen=pen)

    with fig.set_panel(panel=1):
        color = "tomato"
        fig.basemap(region=[0, 4, 0, 3], frame="+thorizontal")
        fig.plot(x=1.5, y=0.5, style="B0.75c", color=color, pen=pen)
        fig.plot(x=3, y=1.5, style="B1c", color=color, pen=pen)
        fig.plot(x=3.5, y=2.5, style="B0.5c+b2", color=color, pen=pen)

fig.show()
Total running time of the script: ( 0 minutes 2.399 seconds)